Data is the heart of statistics. Every analysis, survey, or research depends on the type of data collected. In statistics, data is mainly divided into two types: Qualitative and Quantitative.
In this article, we will explain what qualitative and quantitative data mean, how they are different, and when to use each type — all in simple language.
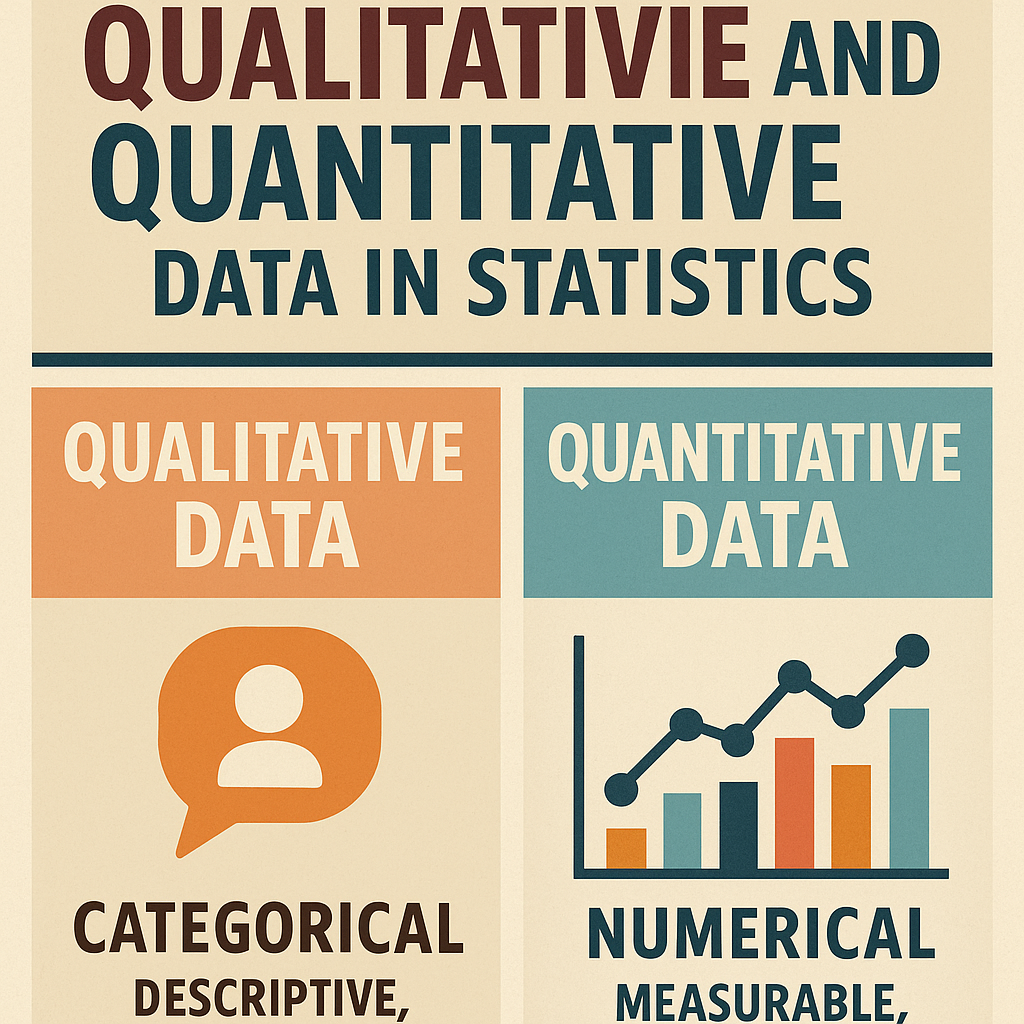
✅ What is Qualitative Data?
Qualitative data (also called categorical data) refers to information that describes qualities, attributes, or characteristics — things that can’t be measured with numbers.
🔹 Examples:
- Colors (Red, Blue, Green)
- Gender (Male, Female, Other)
- Marital Status (Single, Married)
- Feedback (Good, Average, Poor)
🔹 Key Features:
- Descriptive in nature
- Expressed in words, not numbers
- Often grouped into categories or labels
✅ What is Quantitative Data?
Quantitative data refers to information that can be counted or measured numerically. It answers questions like “How many?”, “How much?”, or “How often?”
🔹 Examples:
- Age (23 years)
- Height (170 cm)
- Marks (85 out of 100)
- Number of students (50)
🔹 Key Features:
- Numerical in nature
- Can be measured or calculated
- Can be used in mathematical formulas
✅ Main Differences at a Glance
| Feature | Qualitative Data | Quantitative Data |
|---|---|---|
| Definition | Descriptive, categorical data | Numerical, measurable data |
| Expressed As | Words or labels | Numbers or counts |
| Example | Colors, Gender, Type of Car | Age, Height, Number of items |
| Graph Type | Bar Chart, Pie Chart | Histogram, Line Graph, Scatter Plot |
| Mathematical Use | Cannot perform math operations | Can be added, subtracted, etc. |
| Goal | Classify or label data | Measure or calculate data |
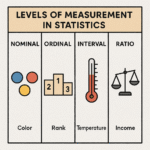
✅ Types of Qualitative and Quantitative Data
🔹 Qualitative Data Types:
- Nominal Data – Categories without any order
Example: Eye color (Blue, Brown, Green) - Ordinal Data – Categories with a logical order
Example: Ratings (Poor, Fair, Good, Excellent)
🔹 Quantitative Data Types:
- Discrete Data – Whole numbers, countable
Example: Number of students in a class (30, 31, etc.) - Continuous Data – Can take any value in a range
Example: Temperature (36.5°C, 37.2°C), Height
✅ Real-Life Examples:
| Scenario | Data Type |
|---|---|
| Survey on favorite subjects | Qualitative |
| Age of students in a class | Quantitative |
| Feedback on a product | Qualitative |
| Weight of grocery items | Quantitative |
| Blood group types (A, B, O) | Qualitative |
| Number of visitors per day | Quantitative |
✅ How to Identify the Type of Data?
Ask yourself:
- Can I measure or count it? → Quantitative
- Is it about a quality, label, or category? → Qualitative
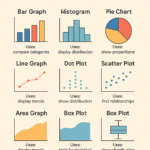
✅ Graphical Representation
| Graph Type | Used For |
|---|---|
| Pie Chart | Qualitative |
| Bar Chart | Qualitative |
| Histogram | Quantitative |
| Line Graph | Quantitative |
| Box Plot | Quantitative |
✅ Why This Difference Matters?
Understanding the difference helps in:
- Choosing the right statistical tools
- Designing better surveys
- Making accurate data interpretations
- Avoiding mistakes in analysis
✅ Common Mistakes to Avoid
❌ Treating qualitative data as numbers
❌ Trying to calculate average of words
❌ Using wrong graph type
❌ Ignoring data type during research
✅ Conclusion
Both qualitative and quantitative data are essential in statistics. Each type has its unique role, purpose, and method of analysis. Whether you’re analyzing customer feedback or tracking population growth, choosing the right type of data is the first step in any successful research.
By knowing the difference, students and professionals can collect better data, make smarter decisions, and perform accurate statistical analysis.
✅ Key Takeaways:
- Qualitative = Descriptive (words/categories)
- Quantitative = Numerical (counts/measurements)
- Each has different uses and graph types
- Correct data type = Correct analysis ✅