In statistics, understanding the levels of measurement is important before collecting or analyzing data. These levels tell us what kind of data we are working with and which statistical methods can be used.
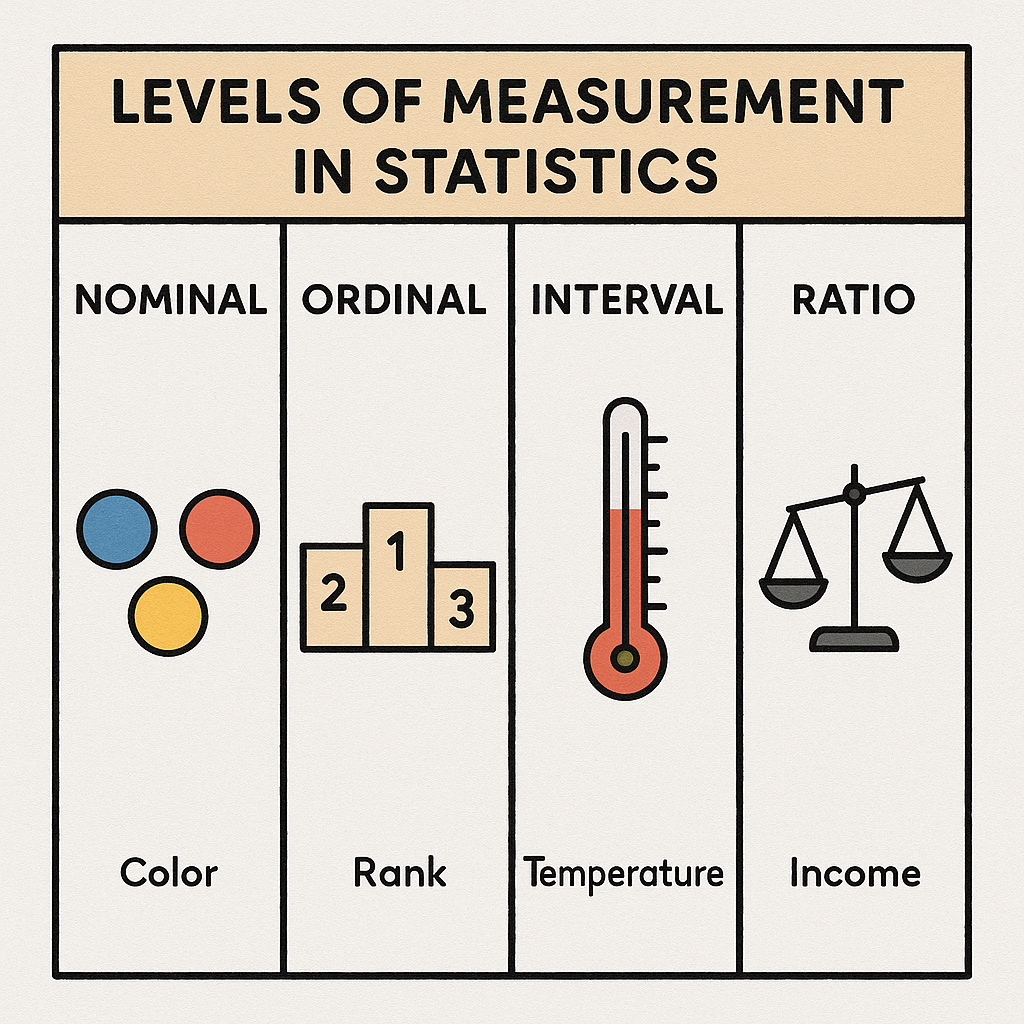
There are four main levels of measurement:
- Nominal
- Ordinal
- Interval
- Ratio
Each level gives us different types of information and helps guide our analysis.
✅ 1. Nominal Level
Nominal data is the simplest type of data. It consists of categories or labels that have no specific order.
🔹 Examples:
- Gender: Male, Female, Other
- Eye Color: Blue, Brown, Green
- Blood Group: A, B, AB, O
🔹 Characteristics:
- No order or ranking
- Used for labeling or classification
- Can’t do math with it
🔹 Graphs Used:
- Pie Chart
- Bar Graph
✅ 2. Ordinal Level
Ordinal data also uses categories, but these categories have a specific order or ranking.
🔹 Examples:
- Movie Ratings: Poor, Fair, Good, Excellent
- Education Level: High School, Graduate, Postgraduate
- Satisfaction Level: Unsatisfied, Neutral, Satisfied
🔹 Characteristics:
- Ordered categories
- Difference between values is not measurable
- You can rank them but can’t calculate exact differences
🔹 Graphs Used:
- Bar Chart
- Column Chart
✅ 3. Interval Level
Interval data is numerical and the difference between values is meaningful, but it does not have a true zero.
🔹 Examples:
- Temperature (°C or °F)
- Dates on a calendar
- Time of the day (e.g., 2 PM, 4 PM)
🔹 Characteristics:
- Measurable differences between values
- No true zero point (zero doesn’t mean ‘nothing’)
- Can do addition/subtraction, but not ratios
🔹 Graphs Used:
- Line Graph
- Histogram
✅ 4. Ratio Level
Ratio data is the most advanced level. It has all features of interval data plus a true zero point.
🔹 Examples:
- Height (in cm or meters)
- Weight (in kg)
- Age
- Salary
- Distance
🔹 Characteristics:
- True zero exists (0 = absence of quantity)
- All mathematical operations are possible
- You can calculate ratios (e.g., 10 kg is twice as heavy as 5 kg)
🔹 Graphs Used:
- Line Graph
- Histogram
- Scatter Plot
✅ Comparison Table
| Feature | Nominal | Ordinal | Interval | Ratio |
|---|---|---|---|---|
| Type of Data | Categorical | Categorical | Numerical | Numerical |
| Order | No | Yes | Yes | Yes |
| Equal Intervals | No | No | Yes | Yes |
| True Zero | No | No | No | Yes |
| Examples | Gender, Colors | Satisfaction | Temperature (°C) | Weight, Age |
| Math Operations | None | None | +, – | +, -, ×, ÷ |
✅ Real-Life Applications
| Scenario | Level of Measurement |
|---|---|
| Blood group of patients | Nominal |
| Rank of students in a competition | Ordinal |
| Temperature recorded daily | Interval |
| Monthly income of employees | Ratio |
✅ Why It Matters
Knowing the level of measurement:
- Helps choose the correct statistical test
- Ensures accurate interpretation of data
- Prevents errors in analysis
- Makes data more meaningful
✅ Quick Guide: What You Can Do at Each Level
| Operation | Nominal | Ordinal | Interval | Ratio |
|---|---|---|---|---|
| Count frequency | ✅ | ✅ | ✅ | ✅ |
| Rank items | ❌ | ✅ | ✅ | ✅ |
| Add or subtract values | ❌ | ❌ | ✅ | ✅ |
| Multiply or divide values | ❌ | ❌ | ❌ | ✅ |
✅ Conclusion
Understanding the four levels of measurement is the first step in any statistical research. From naming categories (nominal) to performing full calculations (ratio), each level builds upon the previous one.
Always identify the level of your data before analyzing it — this will help you choose the right tools, create the right charts, and reach accurate conclusions.
✅ Key Takeaways:
- Nominal = Labels only
- Ordinal = Labels + Order
- Interval = Order + Equal gaps
- Ratio = Interval + True zero
- Higher level = More analysis possibilities