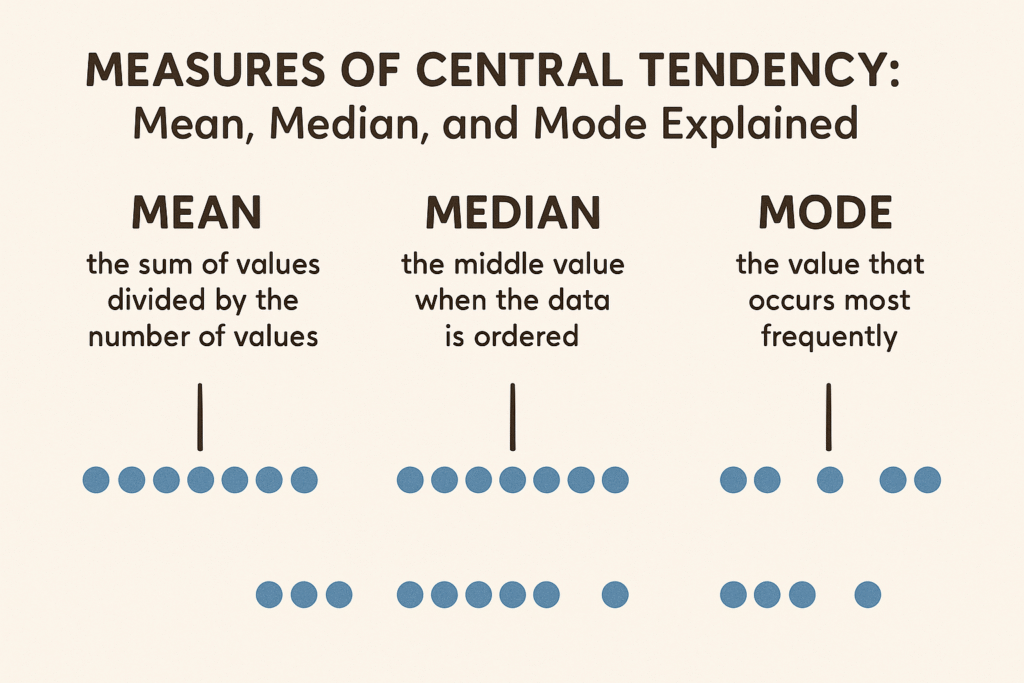
Statistics helps us understand and summarize data. One of the most important concepts in statistics is the Measure of Central Tendency. It tells us where the center of a data set lies.
In this article, we will explain the three main measures of central tendency — Mean, Median, and Mode — in simple English, with examples and comparisons.
✅ What is Central Tendency?
Central tendency refers to the middle or average value in a set of data. It gives us an idea of the “typical” value around which other data points are distributed.
There are three main types:
- Mean
- Median
- Mode
Each one tells us something different and is useful in different situations.
✅ 1. Mean (Average)
The mean is what most people call the “average.” It is calculated by adding all values in a data set and dividing by the total number of values.
🔹 Formula:
Mean=Sum of all valuesNumber of values\text{Mean} = \frac{\text{Sum of all values}}{\text{Number of values}}Mean=Number of valuesSum of all values
🔹 Example:
Data: 4, 6, 8, 10, 12
Mean = (4 + 6 + 8 + 10 + 12) / 5 = 40 / 5 = 8
🔹 Use Case:
Useful when data is evenly distributed and there are no outliers.
✅ 2. Median
The median is the middle value in a sorted data set. If the number of observations is even, the median is the average of the two middle numbers.
🔹 Steps to Find Median:
- Arrange the data in ascending order.
- If odd number of items → middle value is the median.
- If even number → average of two middle values.
🔹 Example:
Data: 5, 7, 9, 11, 13
→ Median = 9 (middle value)
Data: 5, 7, 9, 11
→ Median = (7 + 9)/2 = 8
🔹 Use Case:
Best when data has extreme values (outliers).
✅ 3. Mode
The mode is the value that occurs most frequently in a data set. There can be:
- No mode (if no value repeats),
- One mode (unimodal),
- Two modes (bimodal),
- Or more (multimodal).
🔹 Example:
Data: 3, 5, 6, 6, 8, 9
→ Mode = 6
🔹 Use Case:
Best for categorical data (e.g., favorite color, size, etc.).
✅ Comparison Table
| Feature | Mean | Median | Mode |
|---|---|---|---|
| Definition | Arithmetic average | Middle value | Most frequent value |
| Calculation | Sum ÷ Count | Sort & pick middle | Find most repeated value |
| Sensitive to Outliers | Yes | No | No |
| Use Case | Balanced data | Skewed data | Categorical or repeated values |
✅ Real-Life Applications
| Scenario | Best Measure |
|---|---|
| Test scores | Mean |
| Income distribution | Median |
| Shoe sizes in a shop | Mode |
| Heights of students | Mean or Median |
| Survey of favorite fruits | Mode |
✅ Pros and Cons
🔹 Mean
Pros: Easy to calculate, uses all data
Cons: Affected by outliers
🔹 Median
Pros: Not affected by extreme values
Cons: Ignores most of the data
🔹 Mode
Pros: Useful for non-numerical data
Cons: May not exist or may be more than one
✅ When to Use Which?
| Data Type | Use This Measure |
|---|---|
| No outliers | Mean |
| Skewed data | Median |
| Categorical data | Mode |
| Frequency analysis | Mode |
✅ Summary Points
- Mean is best for normally distributed data.
- Median is best when data contains outliers or is skewed.
- Mode is best for categorical data or frequency counts.
Using all three together gives a clearer picture of the data.
✅ Conclusion
Understanding mean, median, and mode helps us interpret data effectively. Whether you are a student, a researcher, or a data analyst, knowing when and how to use each measure is a fundamental part of statistics.
These measures are not just numbers — they tell stories hidden in data and guide decision-making in education, business, healthcare, and more.
✅ Key Takeaways:
- Mean is the average, Median is the middle, Mode is the most frequent.
- Each has its strengths and ideal use cases.
- Together, they provide a complete picture of data distribution.